I developed a new habit over the last few weeks. During breakfast, I always check the Information Marathon, streamed online by the united Ukrainian tv-channels (along with the QR-code in the upper left corner). I watch only for a minute or two: I don’t understand a word, but it is somehow reassuring to know that they are still (a)live.

This Information Marathon is broadcasted by 21 out of the 33 TV channels measured in ITK’s TAM panel, besides 4 other news channels broadcasting there own content.
You may wonder: what’s the point, if 2,5 million Ukrainians fled the country and millions more are displaced within Ukraine?
Do not forget that Ukraine has about 44 Mio inhabitants in normal times. This means that tens of millions of people in regions not (yet) under attack are trying to carry on with their lives, biting their nails, wondering what happens in neighbouring regions. In Kiev alone, an estimated 2 million people stayed in the city, many of them (on 10/03) still having access to water, electricity, heating, very expensive food and… tv or internet.
ITK’s television audience measurement is a living testimony to this situation. Graph 1 below shows the classical hourly tv reach % on an average day in peacetime (the last full week of January in yellow) and in wartime (days 6 – 12 of the war in blue).
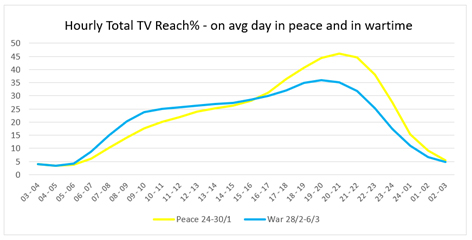
This shows how the yellow primetime peak in the evening has flattened in wartime, and how daytime viewing increased in the morning.
The most striking feature of this graph, however, is the consistent reach of more than 25% from around 10 in the morning till 11 in the evening. Expressed in total tv ratings, the war week was ’only’ 8% lower than the peace week.
Mind you, this is not only viewing of the Information Marathon. Graph 2 below shows the hourly reach of the Information Marathon and of Total TV in wartime.
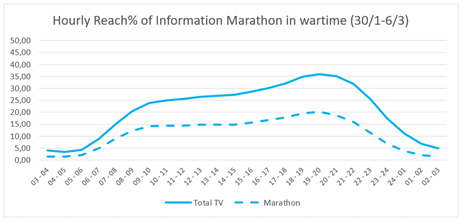
In market share, the information marathon represents around 40%, the other news channels 15%.
The final 45% go essentially to kids and youth channels that still offer entertainment to support younger audiences.
The critical observer may ask whether all of this information is still representative for what really happens in the Ukrainian tv landscape. Nielsen Ukraine is able to keep the number of households that participate in the TAM panel at around 90% compared to the day before the war started.
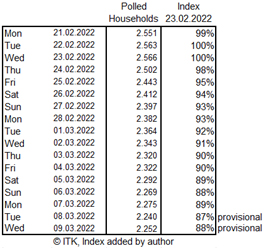
We have no clue to what extent the panel reflects the reality of warzones. Around 2.260 households for a territory that is 110% of France isn’t luxurious but allows strong indications. Even in wartime.
Anyhow, the continued effort of the ITK and Nielsen teams, accompanied by GfK that ensures the tv data exploitation, is commendable. Knowing that the majority of teams have left themselves their homes. A special thanks to the 1+1 people staying in Kyiv, sharing their data with us as if they have nothing better to do…
11.03.2022
Stef Peeters